Social media monitoring means tracking relevant accounts, topics and conversations across social platforms. In this tutorial, Claude Code builds a custom dashboard and AIsa connects it to YouTube, Instagram and SEO data, helping you compare signals and decide what content to create next.
Bring social media monitoring into one dashboard
Identifying the right topics at the right time is a key challenge for any social media content strategy. However, regularly monitoring multiple platforms can quickly become time-consuming. Useful information is scattered across YouTube, Instagram, search engines, ... and this means moving from one source to another, manually comparing results, and trying to identify the topics that are truly worth monitoring.
The goal of this workflow is to automatically centralize this monitoring in a single dashboard.
The dashboard brings together several signals around the same topic in order to follow industry news more easily, identify emerging topics, and find opportunities for your own communication.
It can be used in particular by:
- content creators;
- consultants;
- agencies;
- marketing teams;
- companies that want to monitor their market.
The final goal is not only to collect data, but to turn it into information that is easier to use: which topics keep coming up? On which platforms? Which ones seem to be gaining visibility? Which ones could represent a content or communication opportunity?
The workflow relies on two main elements:
- Claude Code, used to build the dashboard and its logic;
- AIsa, used to connect the dashboard to the various external resources needed for monitoring.
What your social media dashboard will show
The dashboard was designed as a single interface that brings together several data sources and turns them into an actionable monitoring view.
Instead of checking several platforms separately, the user can find the main detected topics and the associated signals in one place.
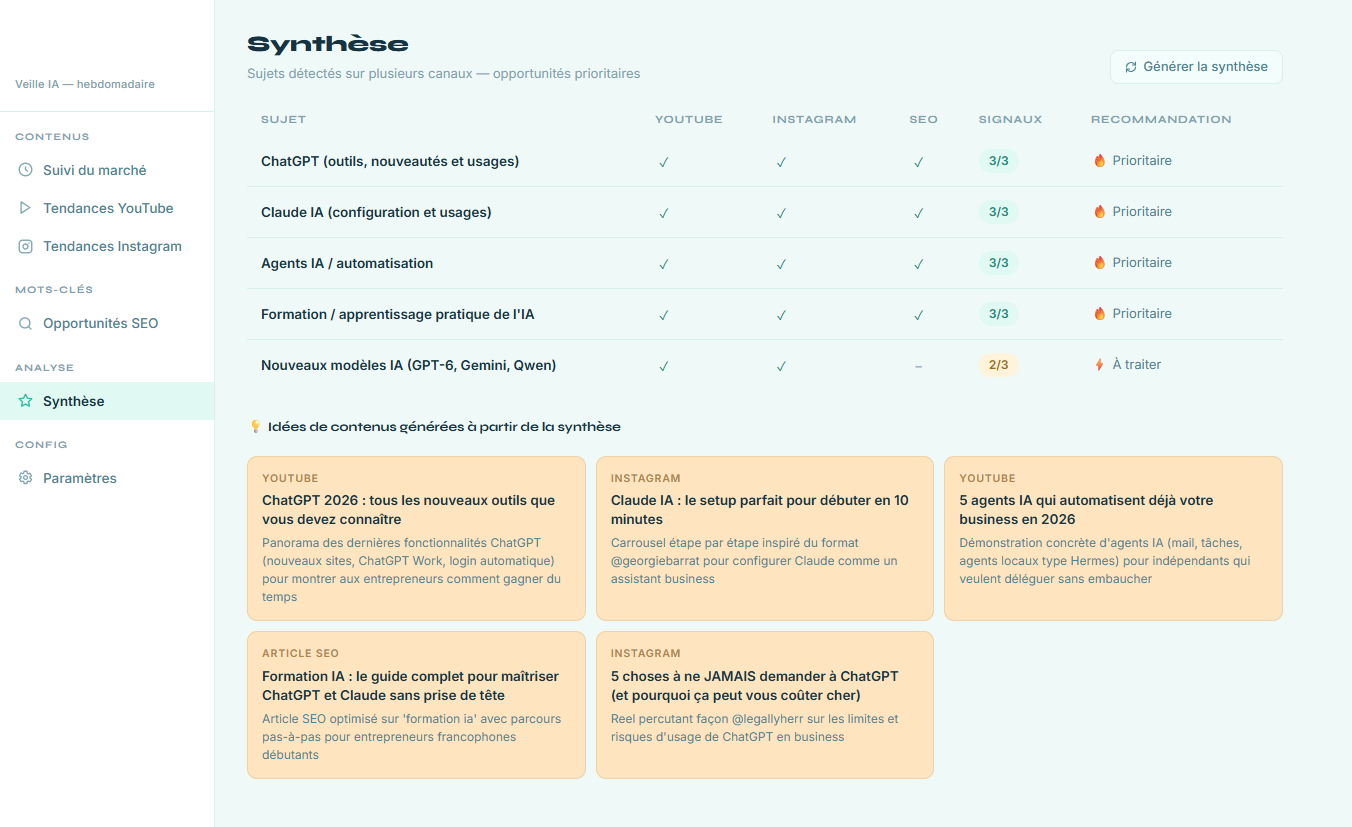
The dashboard can display, in particular:
- identified topics;
- signals collected from different platforms;
- associated content or results;
- data related to search interest;
- indicators used to compare topics;
- content recommendations or opportunities.
The goal of the dashboard is therefore to make one simple decision easier: which topics are worth monitoring or using right now?
Depending on the use case, these results can be used to:
- prepare an editorial calendar;
- find post ideas;
- identify topics for a newsletter;
- follow market news;
- identify topics worth exploring further.
How to build the dashboard with Claude Code and AIsa
The workflow starts with building the application in Claude Code.
Step 1: Build the dashboard interface
The first step is to define the dashboard structure and the information to display.
Claude Code is used to create:
- the interface;
- the different dashboard sections;
- the cards and tables;
- the analysis logic;
- the way the data should be displayed.
At this stage, the dashboard can already exist visually, but it does not yet have the external data needed to power the monitoring process.
Here is a prompt you can use to build your own dashboard. This first step uses fictional data to validate the layout; connect the data sources in the following steps before using its metrics for decisions:
You are an expert web developer. Create a content monitoring dashboard.

━━━ CUSTOMIZATION ━━━

BRAND: [Your brand name]
PRIMARY COLOR: [e.g. #71E6CE]
BACKGROUND COLOR: [e.g. #EFF9F7]
TEXT COLOR: [e.g. #173342]
TOPIC: [e.g. "artificial intelligence", "digital marketing"...]

YOUTUBE ACCOUNTS:
  - [Name] → [URL]
  - [Name] → [URL]

INSTAGRAM ACCOUNTS:
  - [@account] → [URL]
  - [@account] → [URL]

━━━ WHAT YOU NEED TO BUILD ━━━

A web interface (single HTML file) with a sidebar on the left and 4 navigable sections:

1. MARKET MONITORING
   - YouTube / Instagram toggle
   - Horizontal cards: thumbnail on the left + title, account, date, metrics on the right
   - 5 YouTube entries and 5 Instagram entries (fictional data, adapted to [TOPIC])

2. TRENDS OF THE WEEK
   - Same card format
   - 5 popular pieces of content from the French-speaking market (not the monitored accounts)

3. SEO KEYWORDS
   - Table with columns: Keyword · Volume/month · Difficulty · CPC · Content idea
   - 8 fictional keywords consistent with [TOPIC]
   - Colored badge for difficulty: green (low) · yellow (medium) · gray (high)

4. SETTINGS
   - Two panels: monitored YouTube accounts / monitored Instagram accounts
   - Add and remove accounts (in-memory, no persistence)

━━━ TECHNICAL RULES ━━━

- A single HTML file (CSS and JS included)
- All colors as CSS variables on :root
- Navigation using JavaScript show/hide (no reload)
- Entirely fictional data — no API calls
- Google Fonts: Syne (headings) + Inter (text)
- Responsive: works on mobile
- Automatic dark mode (prefers-color-scheme)
- Thumbnails generated dynamically using a hash of the account name (unique and stable gradient)
- Formatted numbers: 1,200 → "1.2k" · 1,200,000 → "1.2M"
Step 2: Connect AIsa to your workflow
The second step is to connect the workflow to AIsa.
AIsa provides access to different external resources through one centralized connection. Explore the API catalog to choose the resources for your dashboard.
The connection is made directly from the Claude Code environment.
The API key must of course remain private and must not appear in screenshots or in the public interface.
Once the connection is set up, Claude Code can call the resources needed for the dashboard to work.
The general principle then becomes:
Claude Code
    ↓
Dashboard
    ↓
AIsa
    ↓
External data sources
    ↓
Dashboard populated with real data
Step 3: Replace sample content with retrieved data
Once AIsa is connected, the dashboard can retrieve the information needed for monitoring.
The data is then:
- retrieved from the different sources;
- grouped by topic;
- analyzed according to the logic defined in the application;
- displayed in the dashboard.
The full demonstration of the connection and how the dashboard works is available in the YouTube video:
Combine YouTube, Instagram and SEO signals
For this workflow, several types of resources are used through AIsa.
The goal is not to rely on a single source, but to cross-check several signals around the same topic.
YouTube: spot recurring video topics
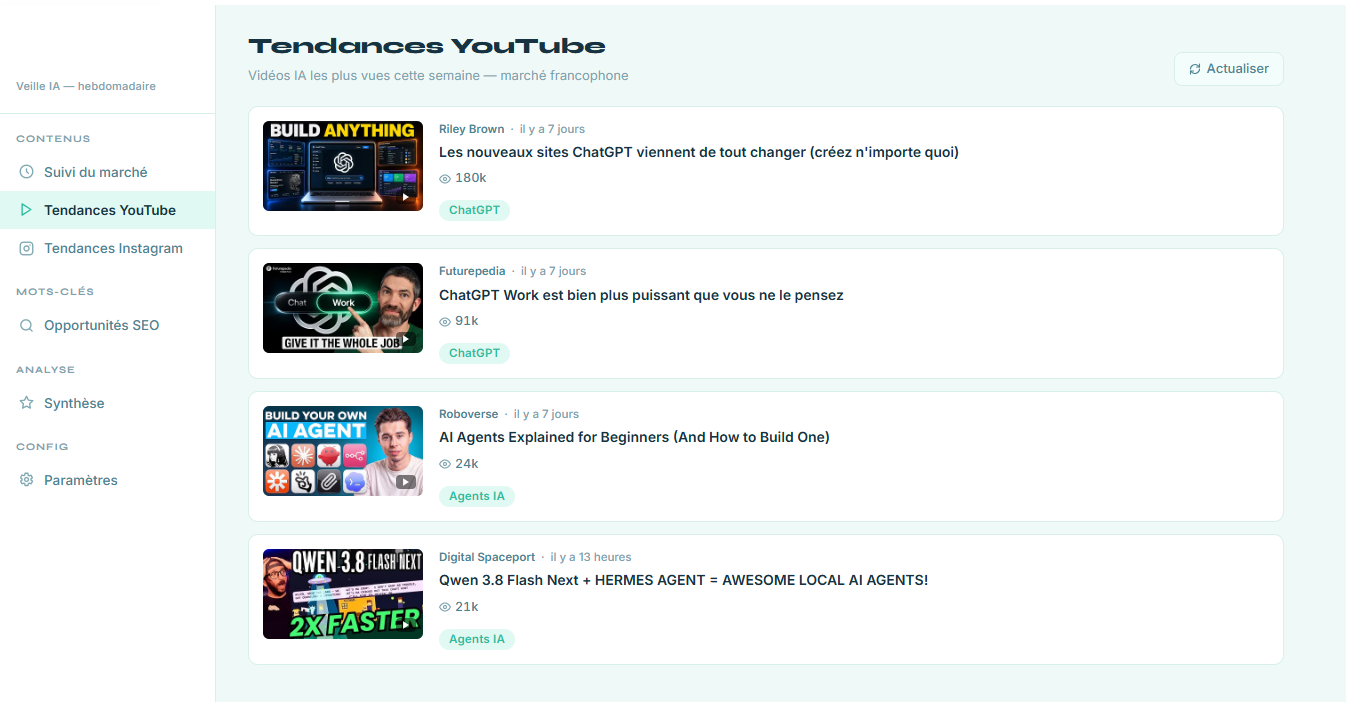
YouTube makes it possible to observe recently published content around a topic.
This data can be used to identify:
- topics that come up regularly;
- recent videos;
- topics currently covered by several creators;
- content that is starting to generate interest.
YouTube therefore provides a first layer of monitoring focused on video content and the topics currently visible on the platform.
| Endpoint AIsa | Used for |
|---|---|
| GET /apis/v1/youtube/search | YouTube search endpoint used in this workflow for account monitoring and market trends |
Instagram: compare posts, Reels and content angles
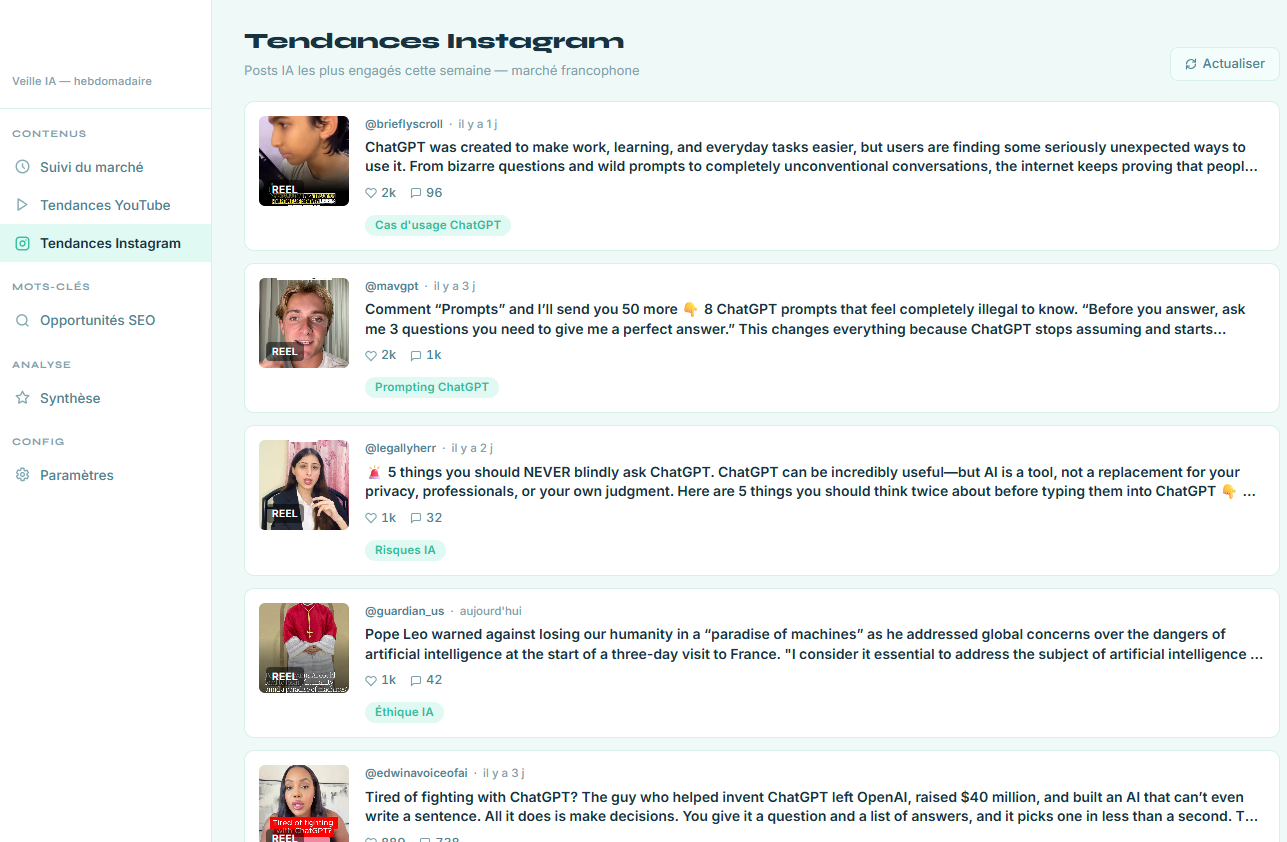
Instagram adds a second social signal.
A topic may, for example, be present on YouTube and also start appearing on Instagram.
Cross-checking these platforms provides a broader view and avoids drawing conclusions from a single source.
Instagram data can be used in particular to:
- observe topics covered by several accounts;
- identify different angles of coverage;
- identify the topics circulating within an industry.
| Endpoint AIsa | Used for |
|---|---|
| GET /apis/v1/instagram/user/posts | Market monitoring — posts from monitored accounts |
| GET /apis/v1/instagram/reels/search | Instagram trends — search by AI hashtags |
| GET /apis/v1/instagram/reels/trending | Instagram trends — complementary pool (AI-filtered) |
| GET /apis/v1/instagram/media/transcript | Transcription of the most engaged Reels |
SEO data: check search interest behind social trends
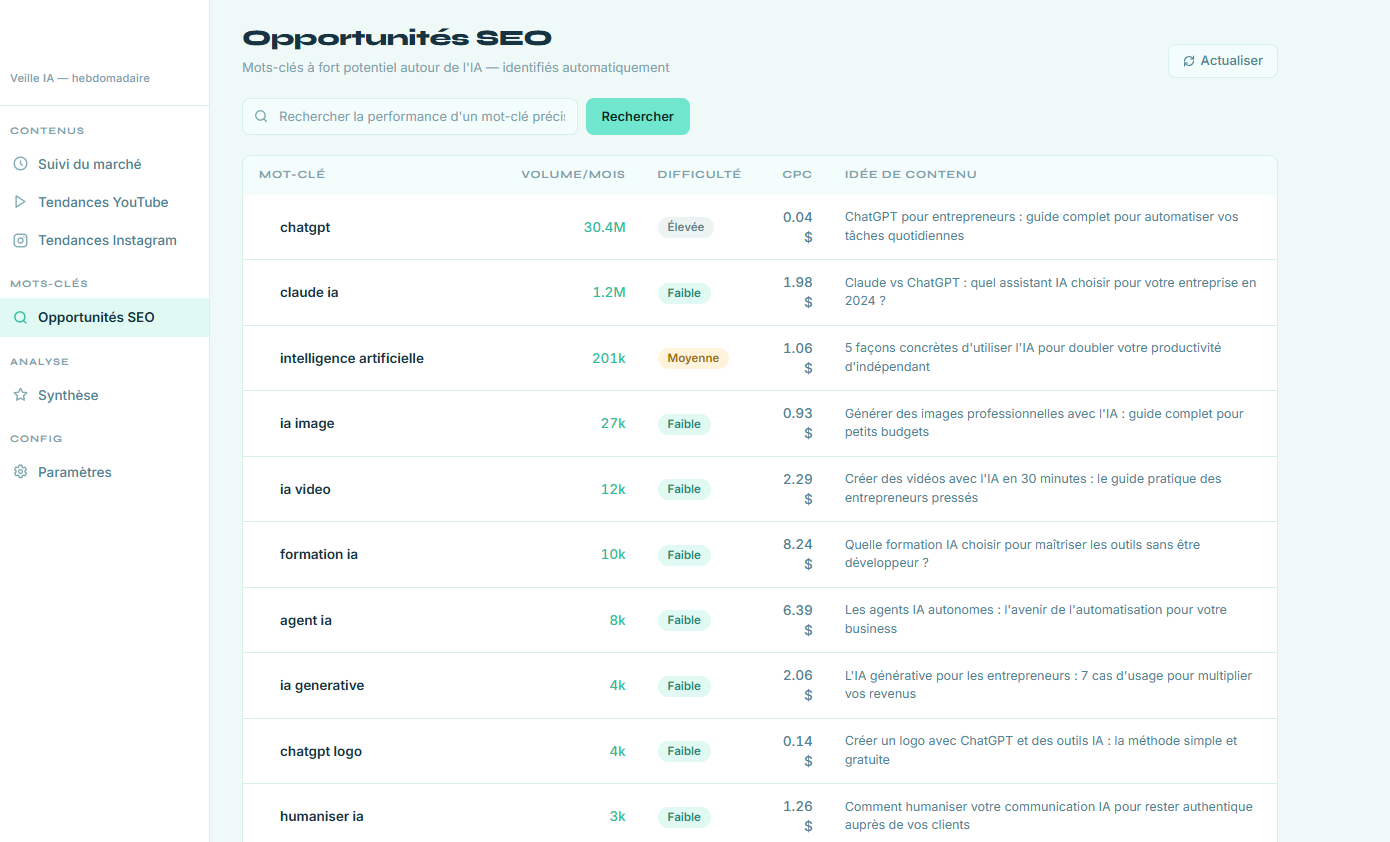
SEO data complements social monitoring.
While social media makes it possible to observe the topics currently being published or discussed, SEO data adds an indication of what users are searching for.
This can help distinguish between:
- a topic that is very present on social media but receives little search interest;
- a topic that is present both in content and in searches;
- a topic that appears to have more lasting interest.
| Endpoint AIsa | Used for |
|---|---|
| POST /apis/v1/dataforseo/dataforseo_labs/google/keyword_overview/live | Broad terms (exact lookup) + search bar for a specific keyword |
| POST /apis/v1/dataforseo/dataforseo_labs/google/keyword_ideas/live | Automatic discovery of long-tail keywords |
In this workflow, YouTube, Instagram, and SEO data therefore provide three complementary signals.
Other sources can naturally be added depending on the need. X or Reddit, for example, may be relevant in some industries, even though they are not used here as primary sources.
Turn monitoring results into content opportunities
Once connected to the different resources, the dashboard can begin producing a centralized monitoring view.
Instead of producing several independent lists of results, the information is grouped around the identified topics.
For each topic, the dashboard can display, for example:
- signals observed on YouTube;
- information collected from Instagram;
- associated SEO data;
- content or communication ideas.
This centralization makes it easier to compare several topics with one another.
The main benefit of the workflow is therefore to move from fragmented monitoring:
YouTube
+
Instagram
+
SEO
+
Manual analysis
+
Note-taking
to a centralized approach:
AIsa resources
    ↓
Dashboard
    ↓
Cross-platform analysis
    ↓
Topics to watch
    ↓
Content opportunities
Keep the source link, retrieval date and reporting period beside each signal. Compare posts over the same time window, distinguish search volume estimates from social engagement, and label missing data rather than treating it as zero. The screenshots illustrate the supplied workflow; their figures are not a current keyword research report.
The dashboard does not replace editorial decision-making.
Its main purpose is to reduce the time needed to collect and compare information, so that more attention can be focused on analyzing the topics that are genuinely interesting.
Adapt the workflow to your market
This workflow mainly demonstrates the value of combining a custom application with several external data sources.
Claude Code makes it possible to build the dashboard, its interface, and its logic.
AIsa then makes it possible to connect this application to the resources needed for monitoring.
The result is a workflow that makes several tasks easier:
- centralize scattered information;
- monitor several platforms from a single interface;
- compare different signals;
- identify emerging topics more quickly;
- turn monitoring into concrete ideas for your communication.
The same logic can be adapted to many other use cases.
For example:
- competitor monitoring;
- market monitoring;
- social listening;
- news monitoring;
- topic research;
- content analysis;
- trend monitoring within a specific industry.
The principle remains the same:
Agent
+
External data
+
Analysis logic
=
Actionable workflow
This dashboard is therefore a concrete example of how AIsa can be used to connect an agent to several data sources and turn this information into a monitoring tool tailored to a specific need.
The full demonstration of the workflow, the AIsa connection, and the dashboard is available here:
FAQ
What is social media monitoring?
Social media monitoring is the process of tracking relevant posts, accounts, keywords and conversations across social platforms. This workflow focuses on topic discovery: it combines YouTube and Instagram content with search data to help you identify ideas for videos, posts and newsletters.
What should a social media monitoring dashboard include?
Include the topics you monitor, source links, publication dates, available engagement metrics and a clear comparison view. For this workflow, add SEO keyword data and content ideas. Show when each source was retrieved and distinguish observed metrics from estimates or sample data.
How do Claude Code and AIsa work together?
Claude Code builds the interface and the logic that groups and displays results. AIsa provides access to the external data resources used by the workflow. Start with the sample dashboard prompt, connect the required resources, then replace the fictional entries with retrieved data. Keep API credentials outside the public interface.
Can I monitor YouTube and Instagram in one dashboard?
Yes. The workflow brings YouTube search results and Instagram posts or Reels into one interface. Group related content by topic and retain the original source links. The available results depend on the selected endpoints, accounts, queries and access limits; the dashboard is not a complete record of every post on either platform.
Can the dashboard refresh automatically, and what does it cost?
Automatic refresh requires a configured schedule or refresh action in the application; the initial interface prompt does not set up background monitoring. Choose a refresh frequency, cache previous results and check current AIsa prices before enabling repeated calls. Costs depend on the resources queried, request volume and any model or hosting usage.