> ## Documentation Index
> Fetch the complete documentation index at: https://aisa.one/docs/llms.txt
> Use this file to discover all available pages before exploring further.
# Dashboard 概览 - 监控你的 LLM API 用量
**Overview** dashboard 会提供 AIsa workspace 的统一视图。它实时展示可用余额、API 活动、资源消耗和模型用量,帮助你快速判断集成是否按预期工作,以及用量正在如何变化。
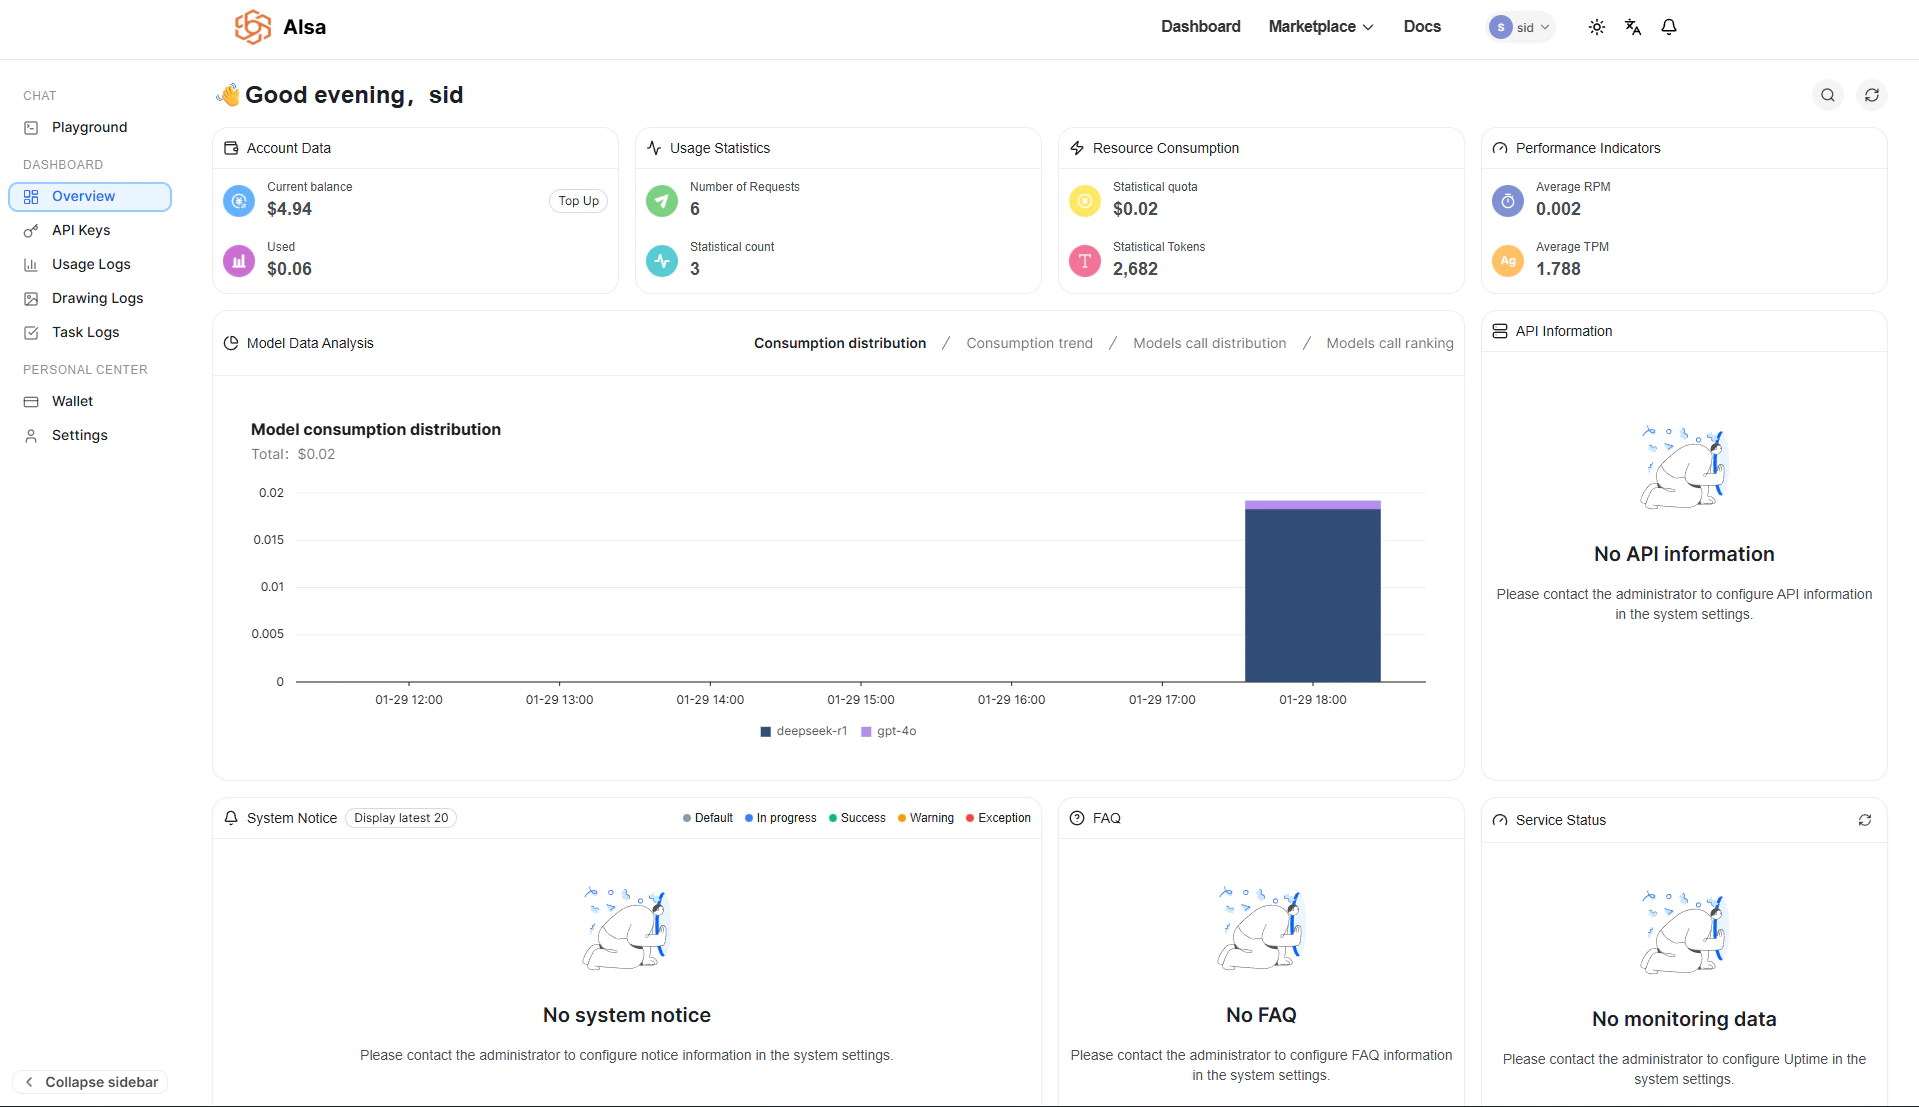
通常在完成 API key 设置、发送测试请求,或监控生产环境持续用量时,可以先查看这个页面。
## Account Data
Account Data 区域反映账户当前的资金状态。
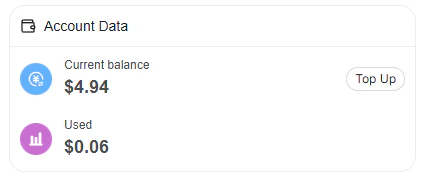 **Current Balance** 显示当前可用于 API 调用的余额。新账户会获得 **\$2.00 免费额度**,请求处理后会自动扣减。
**Used** 表示目前所有 API 调用累计消耗的金额。
如果余额不足,可以使用 **Top Up** 操作充值。所有数值都会随着用量自动更新。
## Usage Statistics
Usage Statistics 用于快速确认请求是否已经到达 AIsa。
**Current Balance** 显示当前可用于 API 调用的余额。新账户会获得 **\$2.00 免费额度**,请求处理后会自动扣减。
**Used** 表示目前所有 API 调用累计消耗的金额。
如果余额不足,可以使用 **Top Up** 操作充值。所有数值都会随着用量自动更新。
## Usage Statistics
Usage Statistics 用于快速确认请求是否已经到达 AIsa。
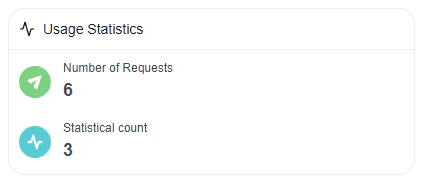 **Number of Requests** 显示所选时间窗口内收到的 API 调用数量。
**Statistical Count** 是用于用量追踪和报表的内部聚合指标。
这两个指标可以帮助你在查看详细请求日志前,先确认账户中确实有请求活动。
## Resource Consumption
Resource Consumption 面板追踪账户额度的使用情况。
**Number of Requests** 显示所选时间窗口内收到的 API 调用数量。
**Statistical Count** 是用于用量追踪和报表的内部聚合指标。
这两个指标可以帮助你在查看详细请求日志前,先确认账户中确实有请求活动。
## Resource Consumption
Resource Consumption 面板追踪账户额度的使用情况。
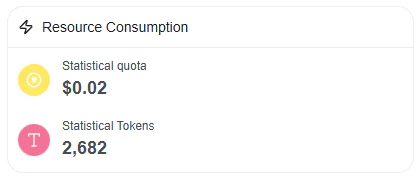 **Statistical Quota** 以金额维度表示总用量。
**Statistical Tokens** 显示所有请求累计处理的 token 数量。
如果还没有产生流量,这些值会保持为 0。随着用量增长,这个区域会成为查看成本可见性的主要入口。
## Performance Indicators
Performance Indicators 描述请求随时间的处理情况。
**Statistical Quota** 以金额维度表示总用量。
**Statistical Tokens** 显示所有请求累计处理的 token 数量。
如果还没有产生流量,这些值会保持为 0。随着用量增长,这个区域会成为查看成本可见性的主要入口。
## Performance Indicators
Performance Indicators 描述请求随时间的处理情况。
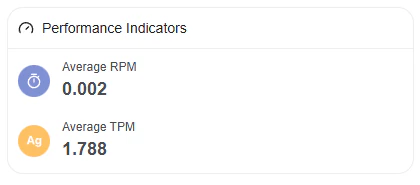 **Average RPM (Requests Per Minute)** 显示平均请求吞吐。
**Average TPM (Tokens Per Minute)** 显示平均 token 处理速率。
这些指标适合用来理解流量模式,并识别突增或持续高负载。
## Model Data Analysis
Model Data Analysis 会按模型拆分用量。
**Average RPM (Requests Per Minute)** 显示平均请求吞吐。
**Average TPM (Tokens Per Minute)** 显示平均 token 处理速率。
这些指标适合用来理解流量模式,并识别突增或持续高负载。
## Model Data Analysis
Model Data Analysis 会按模型拆分用量。
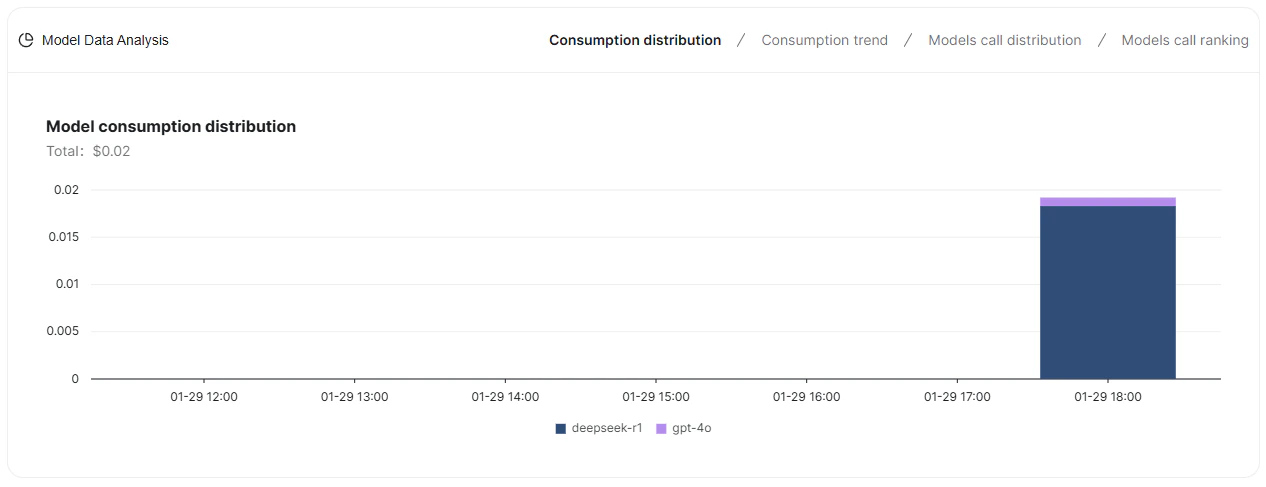 **Consumption Distribution** 视图按模型分组展示一段时间内的总用量和支出,帮助你理解哪些模型贡献了主要成本和调用量。
其他视图可用于分析用量趋势、比较不同模型的调用分布,并按活跃度给模型排序。积累足够流量后,这些图表会自动填充。
## API Information
API Information 面板展示与 API 访问相关的配置详情。
如果这里显示 **No API information**,通常表示尚未创建 API key,或 API 配置尚未完成。你可以在侧边栏的 **API Keys** 区域创建和管理 API key。
## System Notice
System Notice 显示与你的 workspace 相关的平台级公告或运营消息。如果没有配置公告,这个区域会保持为空。
## Service Status
Service Status 显示与账户相关的 AIsa 服务可用性和监控信息。如果未配置监控,这个区域不会展示数据。
## 相关页面
写代码前,先在浏览器里测试任意模型。
查看每次请求的成本、延迟和审计轨迹。
充值额度并管理账单。
**Consumption Distribution** 视图按模型分组展示一段时间内的总用量和支出,帮助你理解哪些模型贡献了主要成本和调用量。
其他视图可用于分析用量趋势、比较不同模型的调用分布,并按活跃度给模型排序。积累足够流量后,这些图表会自动填充。
## API Information
API Information 面板展示与 API 访问相关的配置详情。
如果这里显示 **No API information**,通常表示尚未创建 API key,或 API 配置尚未完成。你可以在侧边栏的 **API Keys** 区域创建和管理 API key。
## System Notice
System Notice 显示与你的 workspace 相关的平台级公告或运营消息。如果没有配置公告,这个区域会保持为空。
## Service Status
Service Status 显示与账户相关的 AIsa 服务可用性和监控信息。如果未配置监控,这个区域不会展示数据。
## 相关页面
写代码前,先在浏览器里测试任意模型。
查看每次请求的成本、延迟和审计轨迹。
充值额度并管理账单。